
t’s my solo project. I led the UX researcher and web analyst of the project for a pet-caring and feeding company. I led efforts to create page speed dashbord for tracking technical issue connectes with page spped of the site.
- Effecrively track page speed on mobile devices
- Quickly send data about pages with low speed to tech team
- Define impact of low page speed to users
The company wants to know how is inner site’s search useful for user. Let’s try to find out it!
For security and confidential reasons, I can’t write information about the company’s name and data. All data collected for this case study was changed and show only tendency, but provided data is not real.
The company sells food for dogs and cats and now stakeholders are faced with the problem of low page speed on the site. Page speed is one of the most important metrics on the site that pay attention search engines. In the instructions for Google assessors we can see that page speed is one of the crucial factors of ranking. Also, we need to pay attention to the user’s side. Our site has only 3 seconds to impress users. In another case, user didn’t want to wait more and closed site and quit. As a result, we have had low engagement and a huge bounce rate. And this is the third reason why our site was placed at the bottom of Google SERP (Search Engine Page Result) Page speed is a complex metric that we need to check and keep a pulse on it. Thus, we need to build dashboard that could reflect the current and retrospective situation with speed of page’s downloading.
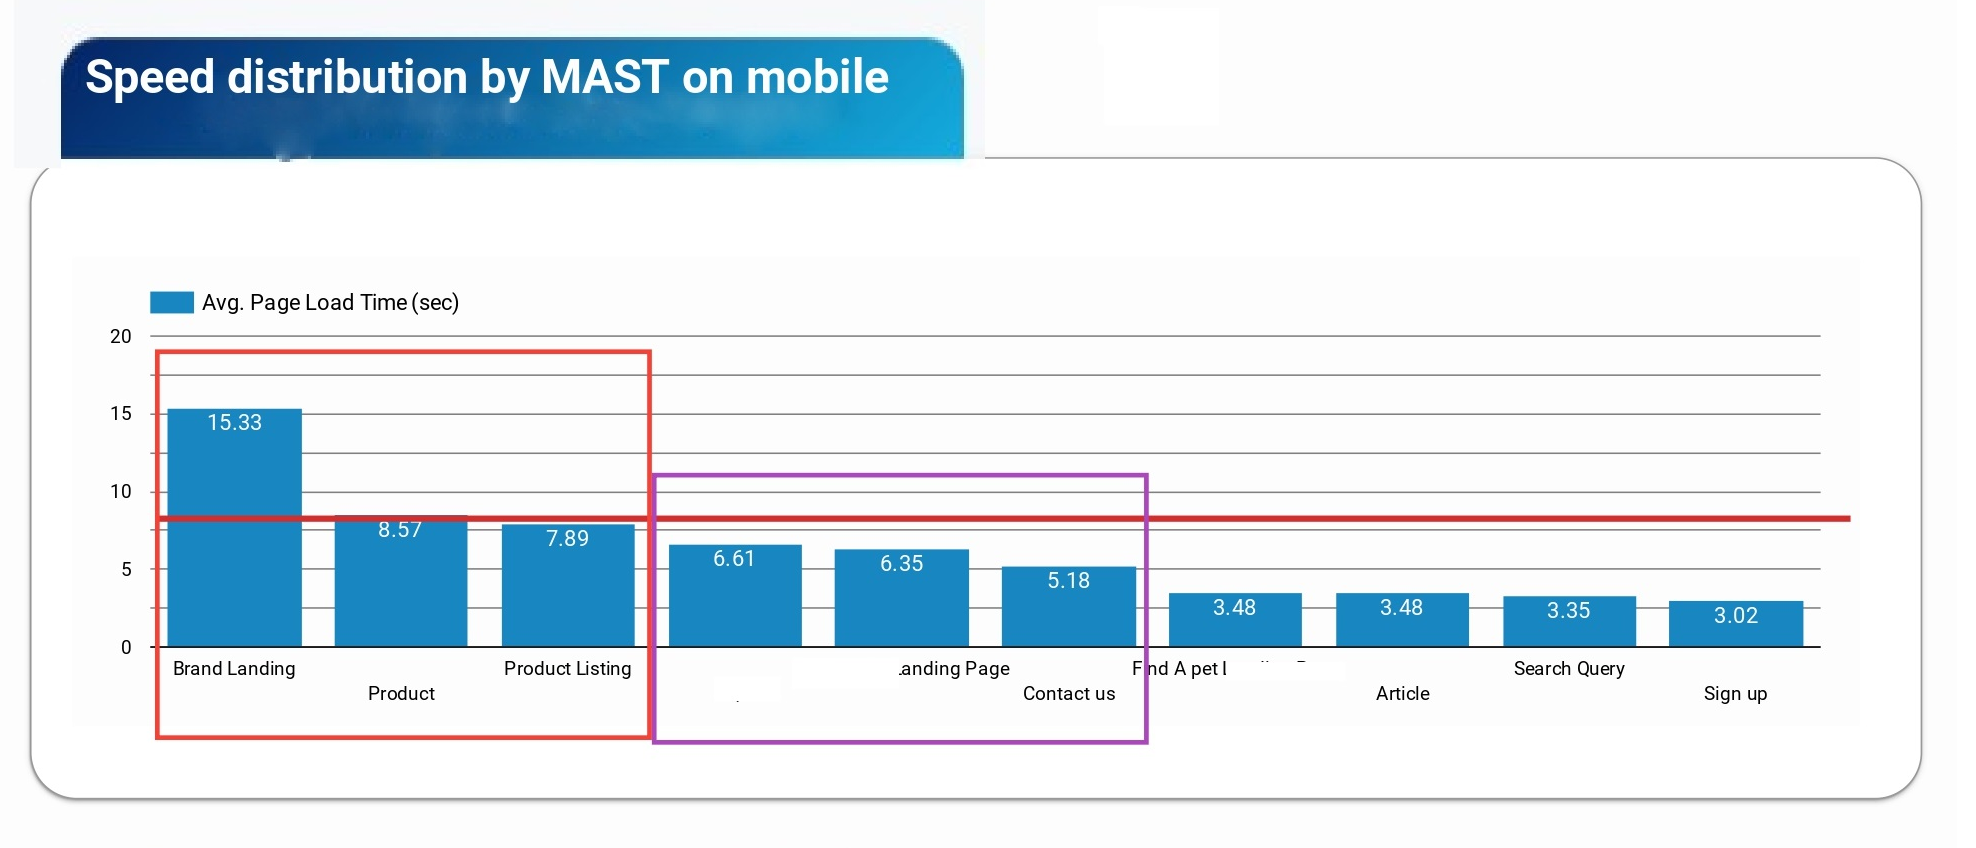
Let’s check all sections of this dashboard The first section is dedicated to the speed of page downloading by content category.
- Red – more than 4 seconds (Huston, we have a problem)
- Orange – 2-3 seconds (It’s ok, but you can make it good)
- Green – less than 1 second (Absolutely great!)
As we can see in the picture, I found a great problem with Branding Landing, Product pages and Product Listing. But here we need to understand that Data Studio collected all data and make median value of page speed for all pages on a category. For example, in Product category, 95% of pages have orange score and only 5% have red score. We need to research this question more deeply to exclude errors of sampling. This part of the report could help to track and manage changes after implementing new elements to the site and keep in touch with page speed.
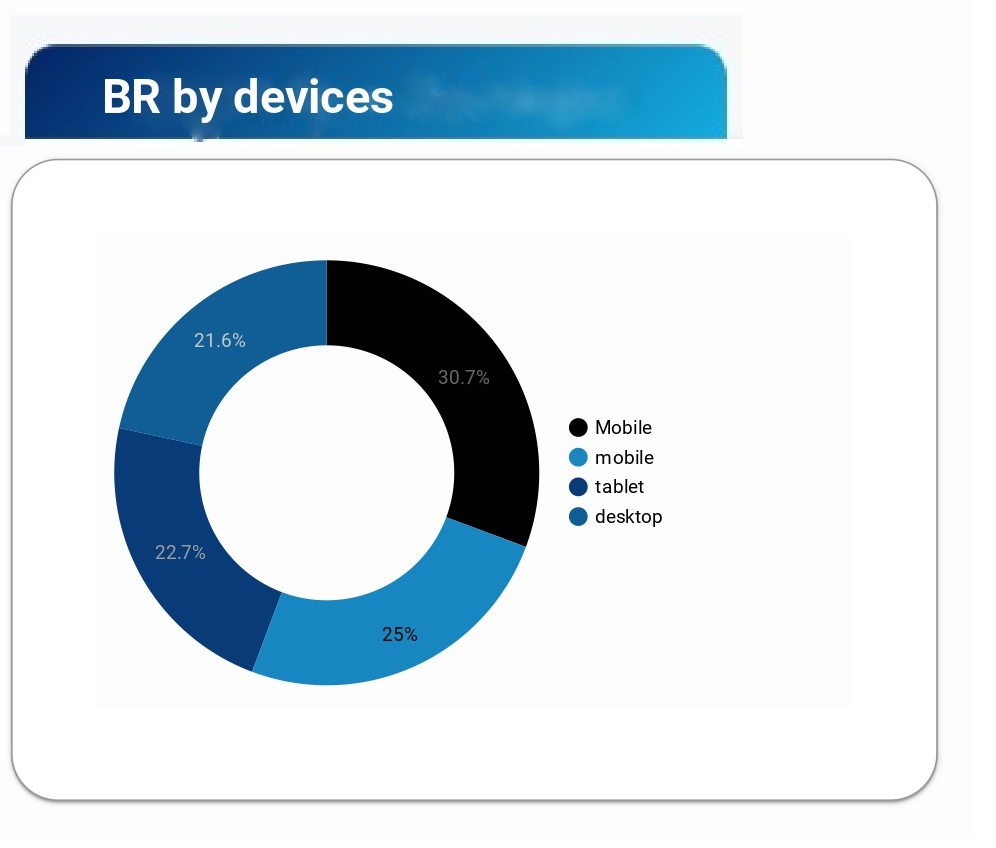
The next section of the report is showing to us which devices have a problem with page speed. As we can see, mobile devices are a leader in low page speed. Thus, the client (here, I mean the company) needs to push the task to the developers to check mobile issues that are tightly connected with page speed like the following – check java script implementation and correctness of this implementation, check all trackers on site and avoid double implementation of two trackers. For example, on this site, the client’s developers implemented two trackers – Glassbox and SessionCam. As we know these trackers are used for just the same issues. And in this case, the capacity of PC resources could download and processed both trackers, but mobile can’t do it and need more time to do it.
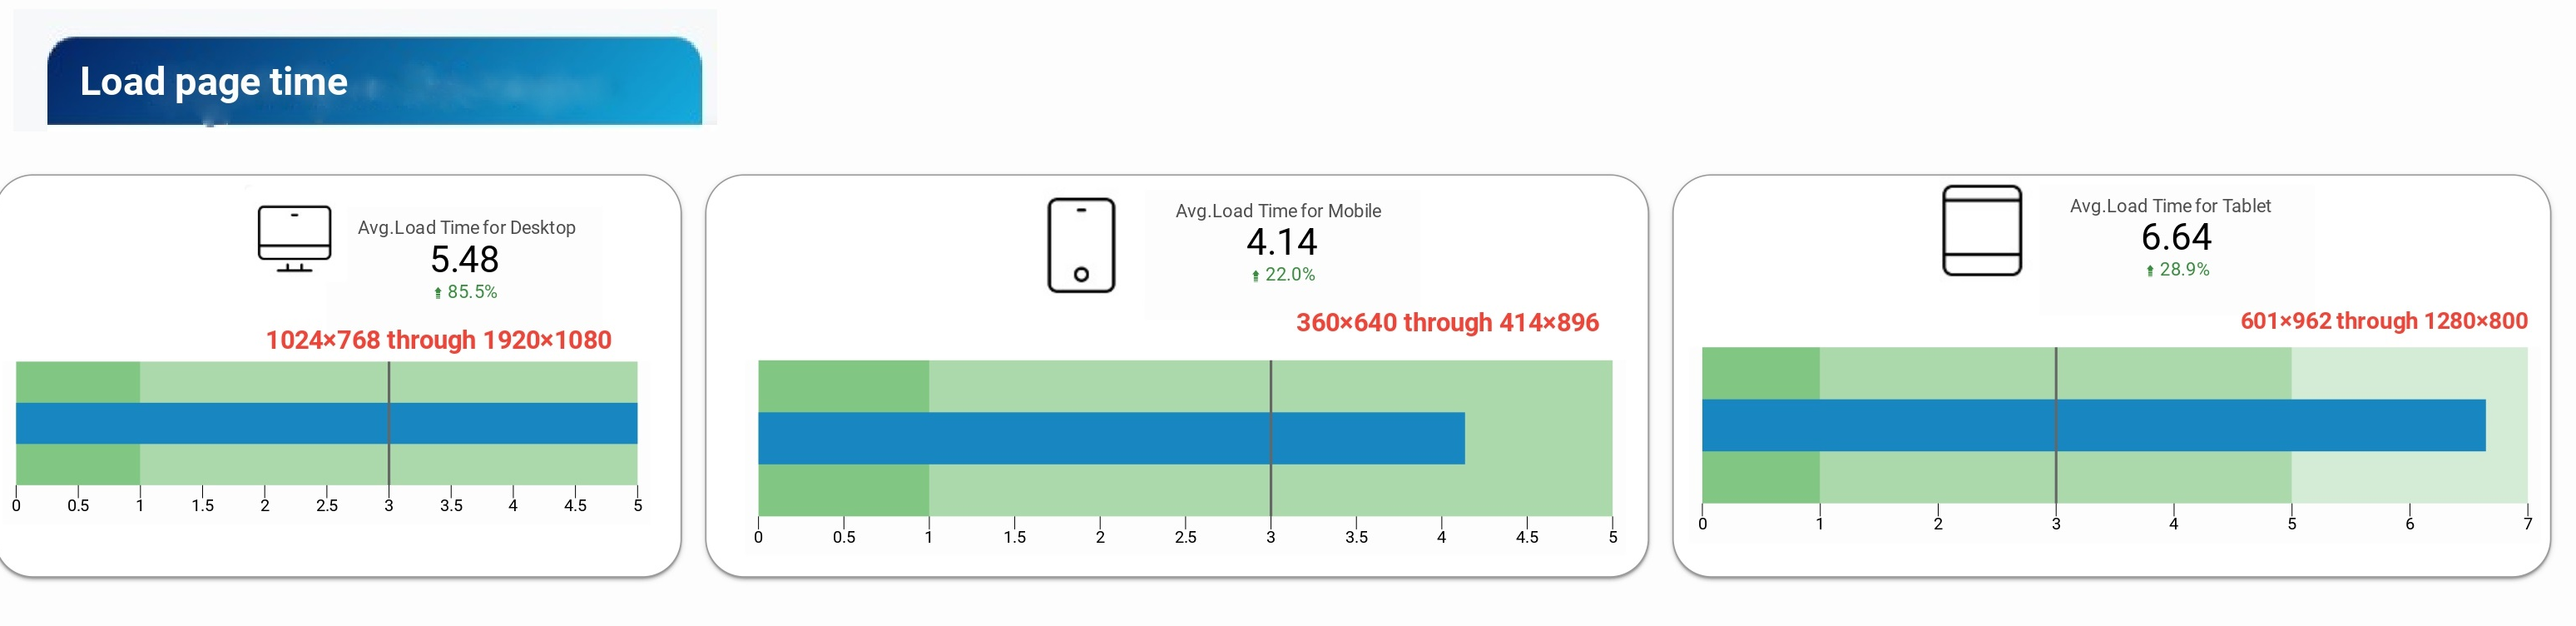
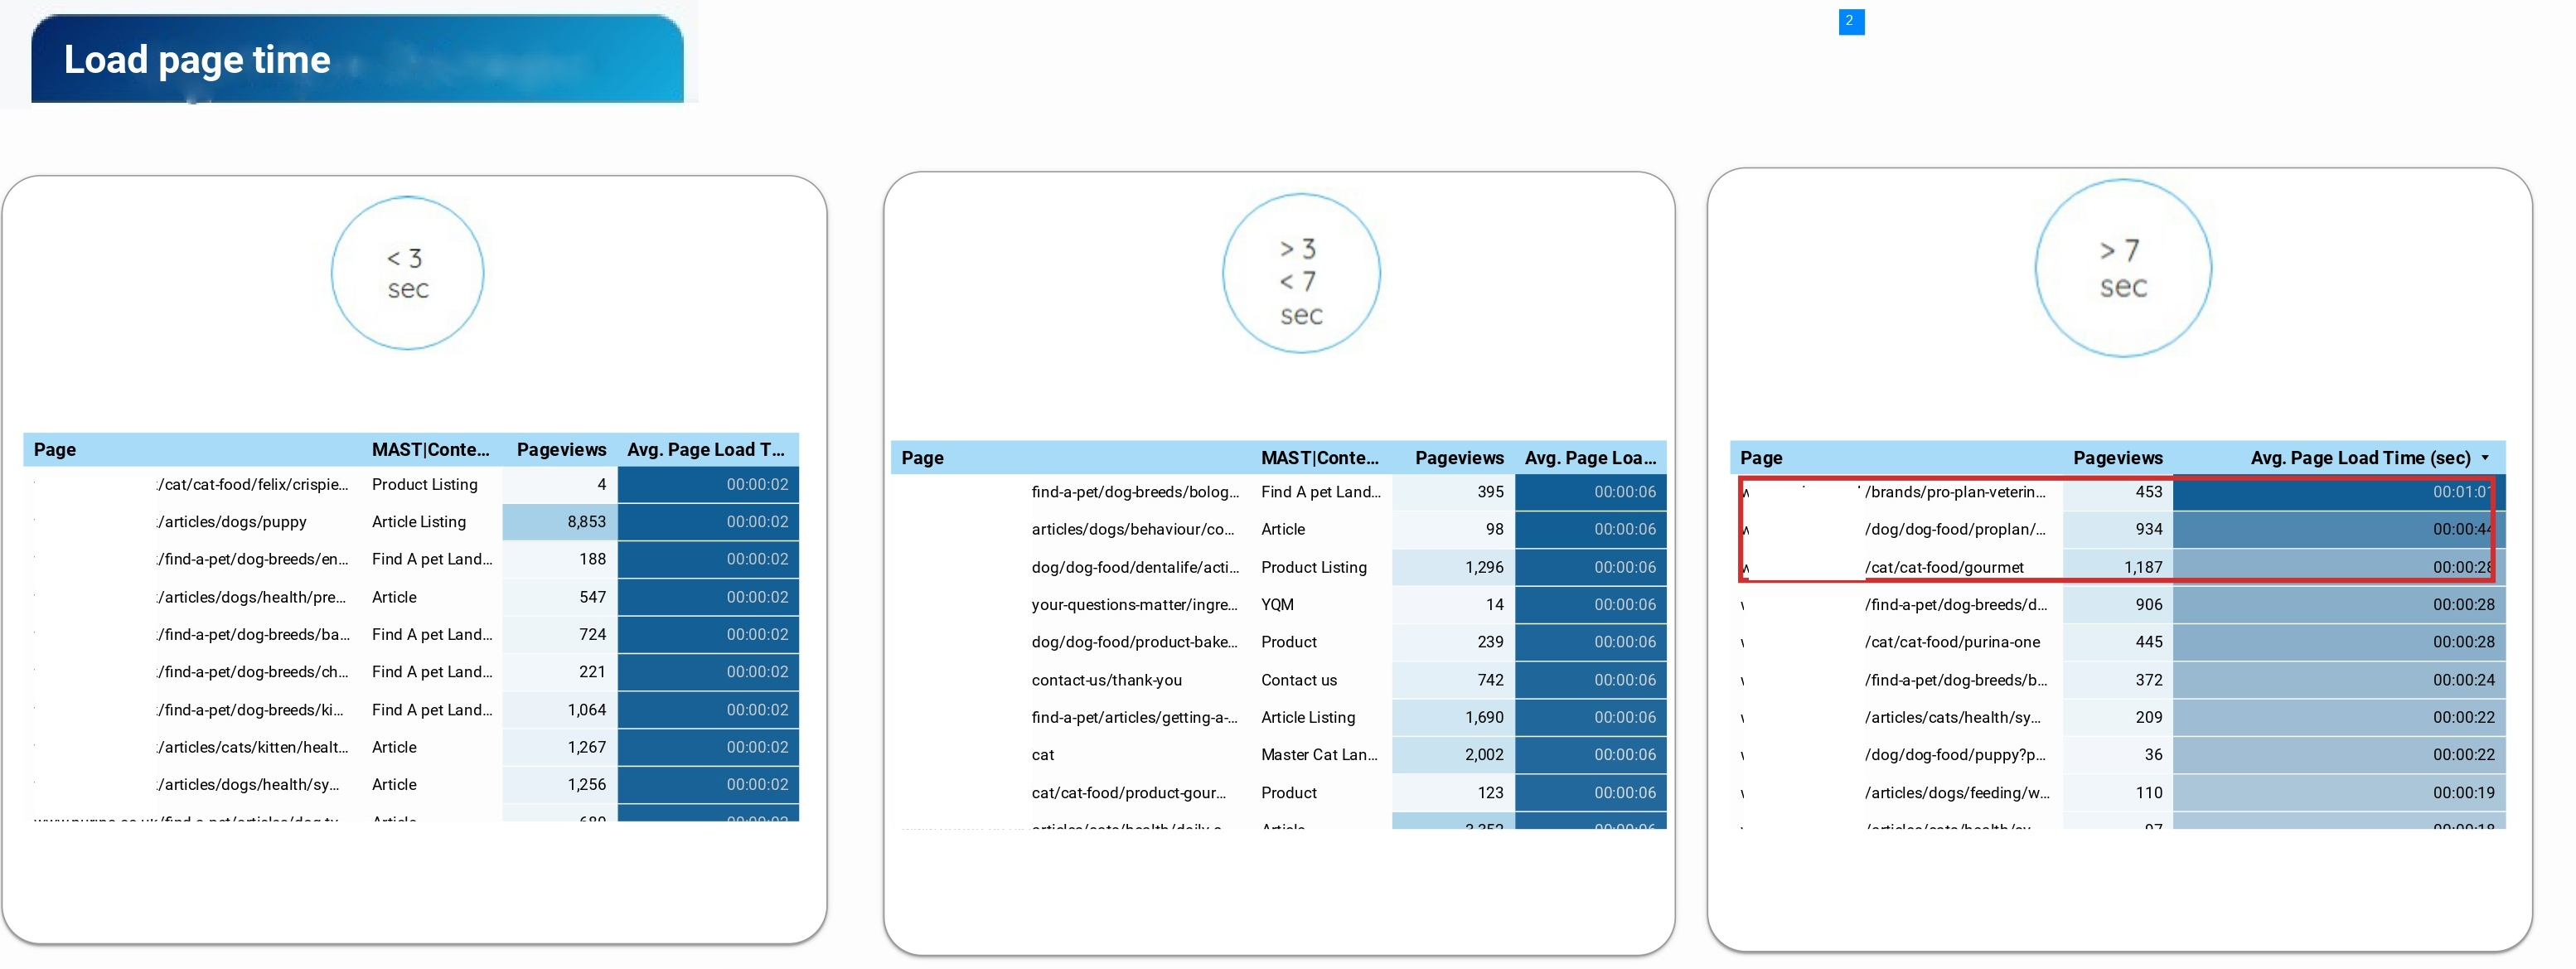
The next chart illustrated the time for downloading for all devices. Here, I specified screen breakdown points for all devices that can highlight the problem and make it easier for web developers to fix it through media-get queries. This part proved the point that mobile and tablet devices can’t processed site so quickly. To underline the problem I divided pages from page categories into three categories of downloading time. The pages from the first category were downloaded in less than three seconds, it’s a good result. Other pages in the following charts showed us pages with lowers page speed scores and here we need to immediately start to work on it. Pay attention that these pages had has pageviews, thus these users are lost for us or users that have a bad experience with site interaction.
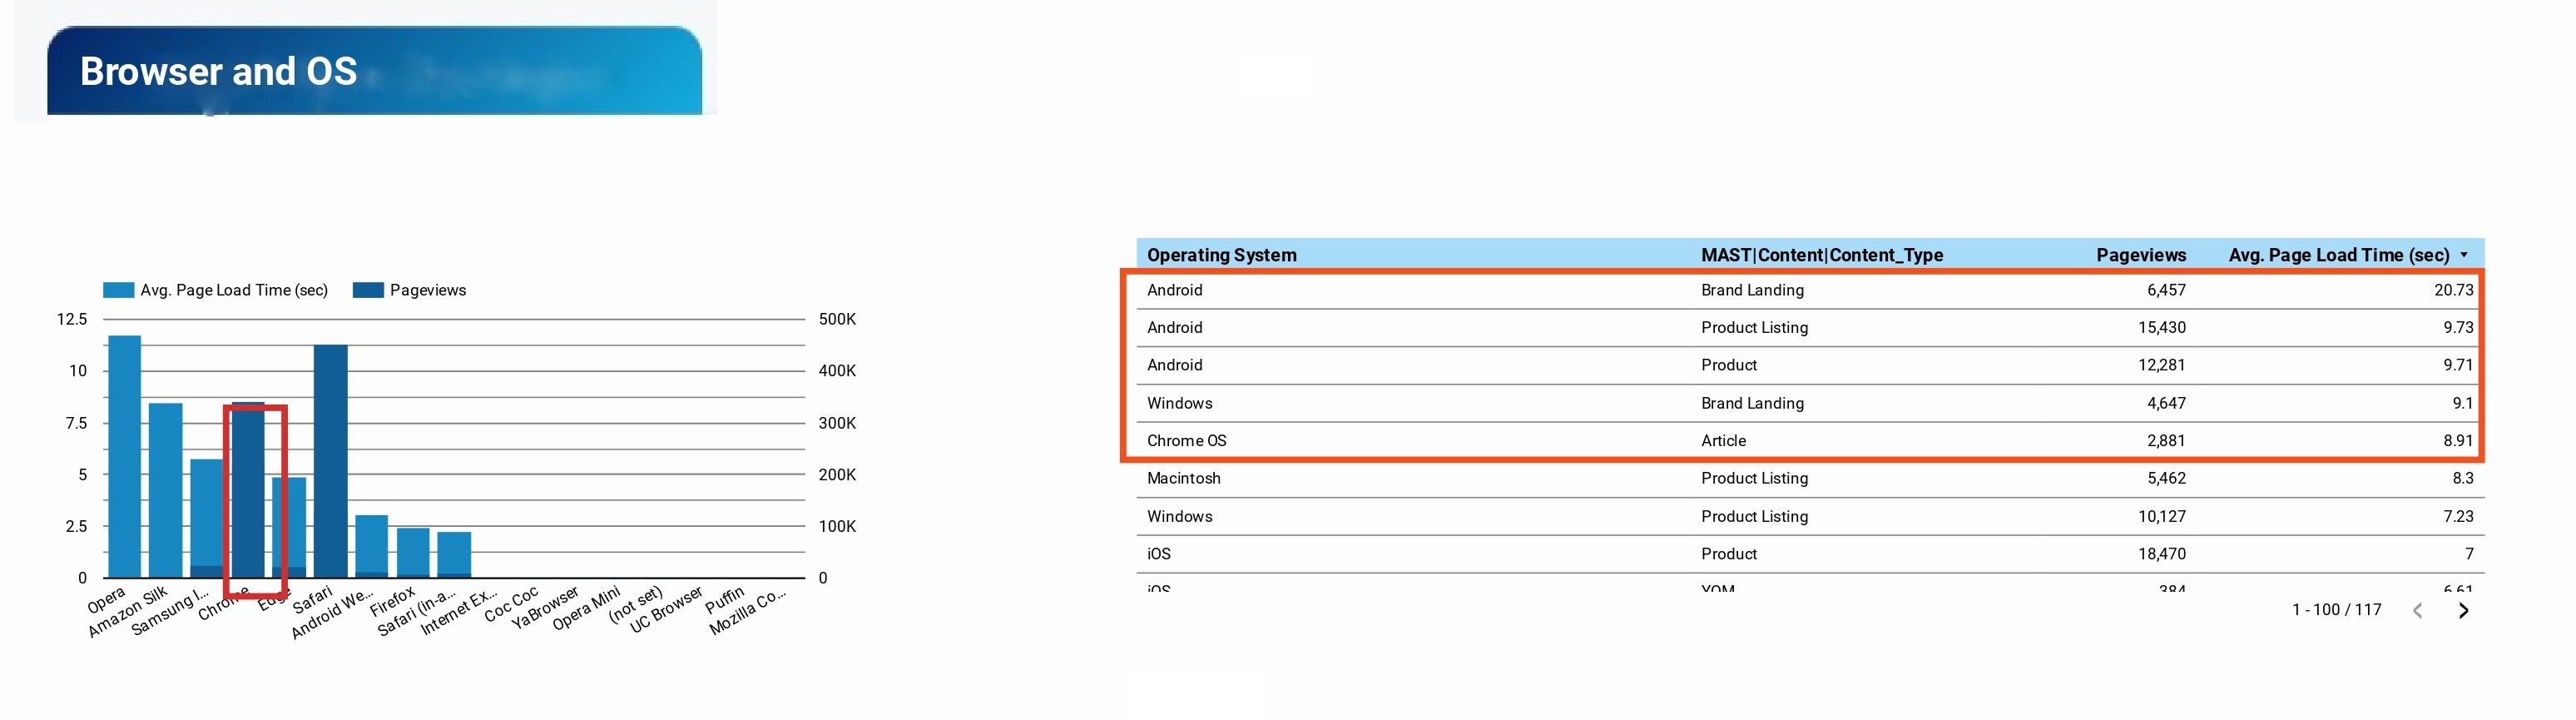
Also, we need to pay attention to cross-browser compatibility. For this purpose, we check the operating system and browser that user’s frequently used to access the site. As we can see our developers need to look out for Opera, Chrome and Safari – the most popular browsers in the world. Also, web dev could improve bugs with Android operational system.
The last step in our investigation is user behaviour connected to page speed. As we can see from the charts, bounced and non-bounced visits have just the same value. What does it mean to the site can help us to understand the following charts? The contribution of new visitors with mobile phones (frankly speaking it’s more than 70% of all traffic) devalued the good score of PC. Just the same result we can see for bounced visits. Here, I need to underline that not only technical issue impacts to users, but also content of the landing and user’s intent has huge power. For example, our user wants to buy wet food for a cat. The user landed on to a page with high-speed of downloading, but the page is not about cat feeding. In case when a site hasn’t had quality navigation or the user doesn’t want to bother to find it, the user exited from the site.
Recommendations:
Check trackers on site
Check js implementation, reduce js amount on site
Minification of js and CSS on site
Reduce the amount of HTTP requests – a unification of js and CSS
Use cache and lazy load for js
Decrease weight of pictures: convert images to more easy-for-downloading like SVG or Webp
Use CDN (Content Delivery Network) for js and huge files